
All you must know
Elucidations and explanations of the JACDEC Risk Index
After a period of thirteen consecutive years of our Safety Index Rating, we decided that it is time for a fundamental change both in terms of methodology and calculation in itself. Why did we do that? Let us explain.
Everyone who is involved in the airline business knows about the complexity of the system. There are dozens of factors that come into play to let an aircraft fly safely from point A to point B.
“To us, safety means the absence of accidents and serious incidents”
We at JACDEC all agreed that it’s time for a next-level approach to measuring the safety of air operators throughout the world. For thirteen years we focussed very much on the accident/incident history of each carrier and disregarded the variety of other influential parameters such as systemic operational risks. We found 2017 was the perfect year to start a new method of measuring safety by making full use of our extensive and steadily growing database where we stored almost 30,000 single occurrences in civil air transportation. In addition, we are doing all we can to bundle up all other safety-related factors such as whether an airline has passed a safety audit or whether the country it operates in can provide adequate safety oversight, or what systemic risks to its everyday operations are prevailing. We also decided it was time to say goodbye to the way we used to present our Index. A three-digit decimal number is no longer suitable to provide a clear and comprehensible depiction of an airline’s safety state. We agreed to express airline safety in a new way, a percentage number.
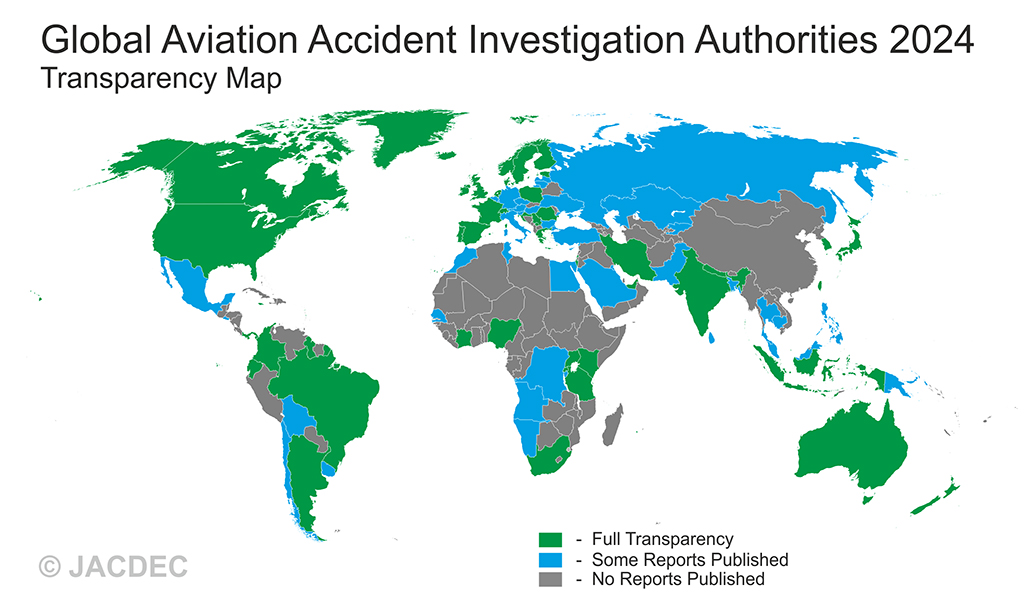
Also, we’d like to emphasize that JACDEC currently obtains all official accident and incident reports from over 90 countries covering a huge portion of global aviation operations. Today, over 7,000 investigation reports Some countries are fully transparent, some do have a journey to go to achieve that level of transparency. We believe in the idea of safety through transparency in a global business where everyone should learn from each other’s experiences. (see map below)
What is the JACDEC Risk Index all about?
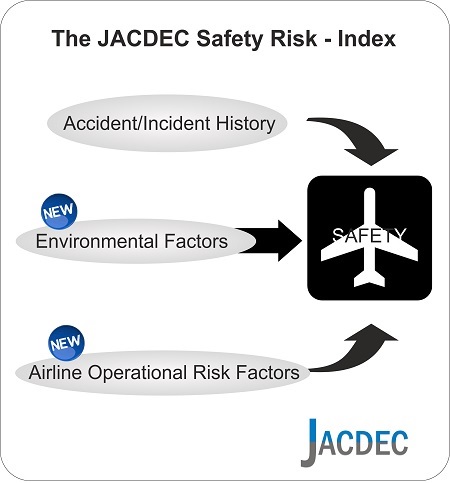
There are three main categories which have an impact on the Risk Index:
1) the Accident / Incidents (Hull Losses, fatalities, injuries),
2) the Environmental Factors (USOAP, Transparency, Terrain, Weather, Infrastructure, etc ..) and
3) Airline Operational Factors (IOSA, Fleet Age, Route Profile, etc .)
The weighting of each of these groups is made up of the frequency of their traceability from our accident database.
Instead of merely comparing the accident history with flight performance, we are now also in a position to evaluate all structural risks that affect airline operations.
You can find a list of all relevant factors and their definition when you scroll further down on this page.
What is new about the JACDEC methodology
All airlines start with a virtual ideal value of 100%. Then every accident or incident, every dead person, every injured person, every benchmark, every audit and every risk reduced this value by a calculated penalty. The more penalty values an airline collects, the lower (or worse) its risk index will be.
In other words, to reach 100% an airline would have to
- remain free from incidents and accidents of any kind for as long as 30 years,
- only serve long-haul flights,
- operate a young fleet (ideal would be between 3 and 9 years),
- pass all the safety assessments relevant to the airline (IOSA, EU Black List) and the home country (such as USOAP, IASA) with top ratings
- be uninvolved in any systemic operational risks such as seasonal bad weather conditions, topography, or many ocean routes, and
- operate in a country whose air safety authorities work transparently enough to publish accident reports on a regular basis.
All parameters combined are 33, which make up the entire Risk Index. This means 366 % more criteria than before.
What does the JACDEC Risk-Index tell me as a passenger?
We all are dealing with any number of risks in our everyday lives and in particular when it comes to air travel. The new Risk-Index is built around the perspective of a passenger who intends to distinguish airlines by their existent level of safety risks rather than their ratio between bygone accidents and flight performance. So we broadened our viewpoint and gathered all available criteria that impact the safety of commercial aviation in any way.
The new Risk-Index expresses the quintessence of all available criteria influencing the safety of a flight.
A crucial section of our safety assessment is about environmental factors such as the quality of safety oversight of the country a certain operator (airline) is based in. One lesson of our now decade-long experience in aviation safety analysis is the following: There is a direct correlation between the safety of an airline and the competence and transparency of the regulating authorities.
For instance, we evaluate the results of the so-called USOAP, this abbreviation stands for Universal Safety Oversight Audit Programme. In this global program, guided by all ICAO members, the whole civil aviation system is undergoing a voluntary audit.
In particular, it investigates how a country is able to meet and maintain defined standards of aviation safety. [USOAP Website]
The results of this investigation will be published on a website and can be viewed by everyone.
Furthermore, we looked at the level of transparency a governing authority has got. We ask: Are there all relevant occurrences laid on the table, or not? Compared to earlier years, The past years gave us some encouraging results, but many important players like China, Turkey or Mexico failed to open their accident investigations to a wider audience.
Countries like the USA, the UK, Canada, France and Australia took the lead and implemented an exemplary system of reporting, investigation, and publishing of any relevant safety cases regardless of whether the major flag carriers are involved or not. Also, Brazil, Colombia, South Africa, Germany, Indonesia, Japan, Taiwan, and the Scandinavian countries have a comparably high level of transparency resulting in a positive impact on our Index calculations. Countries that do not or only sporadically publish accident investigations, got a lower rating, such as China, Malaysia, Thailand, and Turkey.
Coming back to our index criteria: we distinguish whether an event is a Hull Loss (or total loss) or a Serious Incident: Both will be recorded in our JACDEC Database, but in the final weighting a total loss counts considerably more. As always we include only flights where paying passengers have been on board. Therefore we disregard all non-revenue flights such as freight, ferry, training, military or technical check flights.
The results of this investigation will be published on a website and can be viewed by everyone.
Boundaries and Limitations
It may dawn on you that even the best kind of Airline Safety Index must be regarded as imperfect because of the complexity of all it takes to minimize the risk of accidents. We would be a phony to deny that. Some essential sectors like the skills of aircrews or maintenance aspects are only superficially covered. Mostly because there still is a lack of a global benchmark or a transparent supranational audit dealing with those sectors.
Nonetheless, the JACDEC Risk-Index can be regarded as an approximate value and in our view the best possible way to give travelers an idea of how different air operators are doing in the field of safety. And 2ndly we believe it is a helpful tool to compare the larger airlines of the world by their combined safety parameters.

The JACDEC Methodology and Definitions
The index is based on thousands of accident analyses and a variety of official sources and documents of recognized institutions. To us all accidents that are being investigated and documented by authorities are relevant. As of 2022 more than 4000 official reports have been analyzed by JACDEC. We do not make any difference in terms of cause or guilt. Only passenger flights counted. 3rd party victims in other planes or on the ground are excluded from the Risk-Index.
We count only airlines having accumulated at least 4 consecutive years of revenue passenger operation and performed a minimum of 1 m revenue passenger kilometers per annum.
Over the years our way of measuring safety has become more and more complex, accurate, and meaningful. It now has a level that allows us to scientifically compare the safety status of most of the airlines in the world.
The current JACDEC Safety Risk-Index calculation is based on a variety of components. Here we name the most relevant of them.
| 1 Accident / Incident History | Annual Revenue Passengers Kilometers( RPKs ) | By using this number, we determine the flight performance of an airline. At nearly all major airlines, it is a default value. For calculating the index we use the cumulative RPK ‘s – depending on the age of the airline – 30 years back. A time weighting factor (EMA) is imposed. |
| Fatalities | For calculating the index we include all deaths among all occupants on board commercial passenger flights of an airline. (Time from boarding to de-boarding) For calculating the Index we use the number of victims – depending on the age of the airline – up to 30 years back. A time weighting factor (EMA) is imposed. | |
| No. of Injuries | The Universal Safety Oversight Programme was implemented and carried out by ICAO. It has become the global benchmark in determining a country’s ability to maintain a high standard of safety in all its airports, facilities, aviation companies, and airlines. | |
| No. of Total Losses | All onboard injuries, and serious injuries that need further medical attention. A time weighting factor (EMA) is imposed. | |
| No. of Serious Incidents | The term “serious incident” is defined by international standards and refers to incidents where an accident was only narrowly avoided. A serious incident is weighted less than a Hull Loss. A time weighting factor (EMA) is imposed. | |
| No. of incidents | An incident is weighted below the severity of a serious incident but with the potential to affect the safety on board an aircraft. It has the lowest impact on the overall calculation in this category. |
The 2nd group of influential factors is environmental issues. For example, the safety level of the country an airline operates in, country safety audits, and regional safety risks such as weather or topography.
| 2 Environmental Factors | IASA Audit | By that, we mean (as described before) the level of government openness in the field of aviation safety and in particular when it comes to reporting civilian air accidents. It ranks between „good“ (all relevant reports were made publicly available), „medium“ (only few reports available), and „bad“(no reports available). |
| Transparency Category | The Universal Safety Oversight Programme was implemented and carried out by ICAO. It has become the global benchmark in determining a country’s ability to maintain a high standard of safety in all its airports, facilities, aviation companies, and airlines. | |
| USOAP Audit | The Universal Safety Oversight Programme was implemented and carried out by ICAO. It has become the global benchmark in determining a country’s ability to maintain a high standard of safety to all its airports, facilities, aviation companies, and airlines. | |
| Country Risk Factors 1 | All known risks could have a direct adverse effect on aviation safety in the country. For example, high terrain, and seasonal harsh weather (snow + ice, tropical storms). | |
| Country Risk Factors 2 | All known risks that could have an indirect adverse effect on aviation safety in the country. For example a systemic lack of ground infrastructure and a degraded level of security. |
The 3rd group, it is the airline itself and all the operator-related risk factors we’re looking at.
| 3 Airline Factors | IOSA Audit | The International Air Transport Association (IATA) established the IATA Operational Safety Audit (IOSA) Programme, now internationally recognized and accepted, as an evaluation system designed to assess the operational management and control systems of an airline. The aims of the IOSA program are (1) to improve airline operational safety through the industry’s first globally accepted audit program using internationally harmonized standards. (2) To improve airline efficiency by eliminating redundant audits. |
| Fleet Age | As our database showed us, there is a link between the age of an aircraft and its vulnerability to operational mishaps, incidents, and even accidents. Keeping a fleet youthful means an airline is less susceptible to technical glitches and generally operates on a lower risk level then airlines having older fleets. | |
| Route Profile | Database evidence has shown us that 2/3 of all accident/incident cases happen at or nearby an airport making the landing and take-off the riskiest part of air transportation. Airlines having mostly long-haul flights (1 – 2 flights per day) have a lesser risk to get involved in accidents compared to airlines with only short-haul flights doing six or more flights per day. | |
| EU Safety List of Banned Airlines | The so-called „Black List“ of the European Commission comprises airlines that do not fulfill the required safety standards. All airlines among this list are banned from entering EU airspace unless safety requirements are met. The list is continuously updated. | |
| Operational Risks | All known risks that could have a direct adverse effect on everyday safety for the airline such as airport infrastructure or the number of overwater routes. |
In case there is any further question about our approach to calculating airline safety and risk factors, please let us know and send us a message.
Always Happy Landings,
JACDEC