Charts & Graphs

Every year JACDEC puts out a number of accident & safety statistics based on our database. Here’s a variety of graphics summarizing the accident and incident distribution across the planet and other safety data evaluations.

25 Year Statistics of all Fatalities and Hull Losses Worldwide © JACDEC Database Svcs.

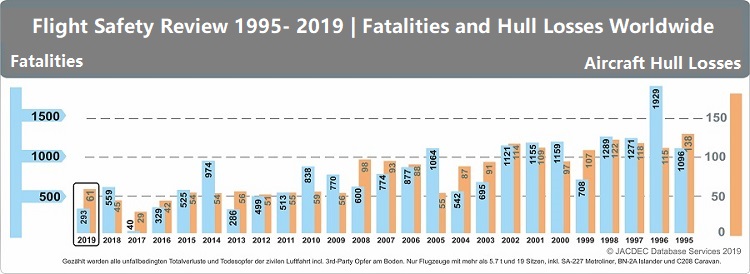
Worldmaps of all Hull Losses and Serious Incidents since 2015

Worldmap of all accidents and serious incidents in 2019 distinguished by their severity.
Worldmap of all accidents and serious incidents in 2018 distinguished by their severity.
Worldmap of all accidents and serious incidents in 2017 distinguished by their severity.
Worldmap of all accidents and serious incidents in 2016 distinguished by their severity.
Worldmap of all accidents and serious incidents in 2015 distinguished by their severity.

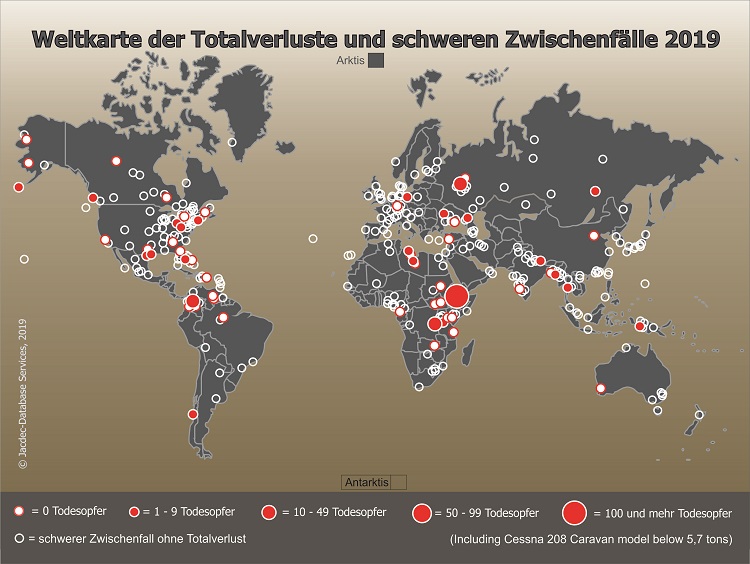
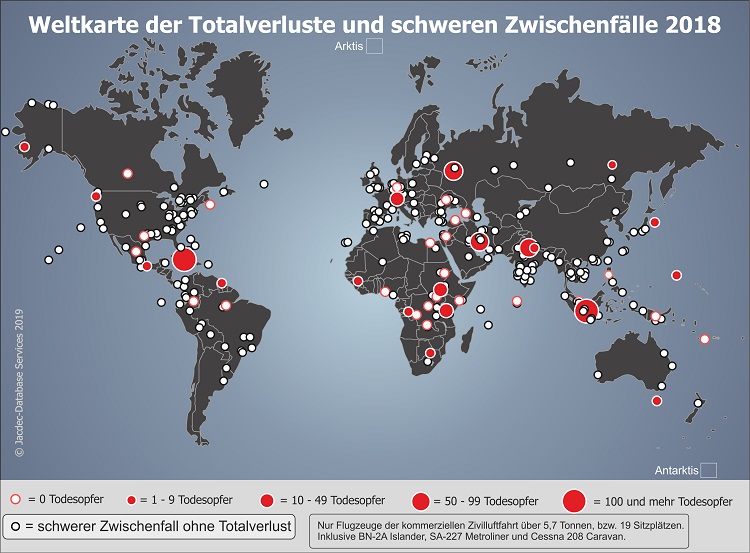
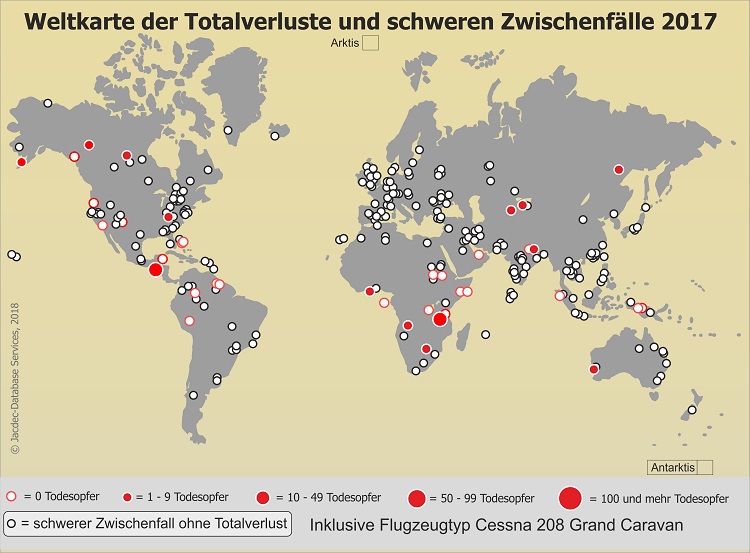
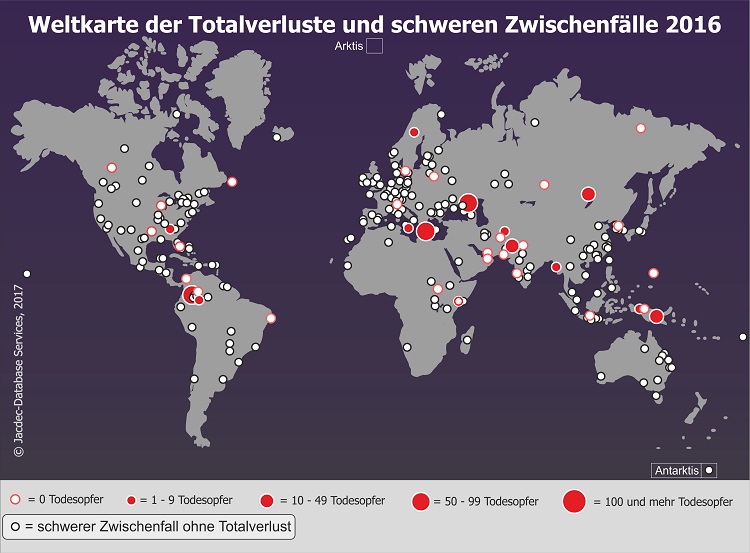
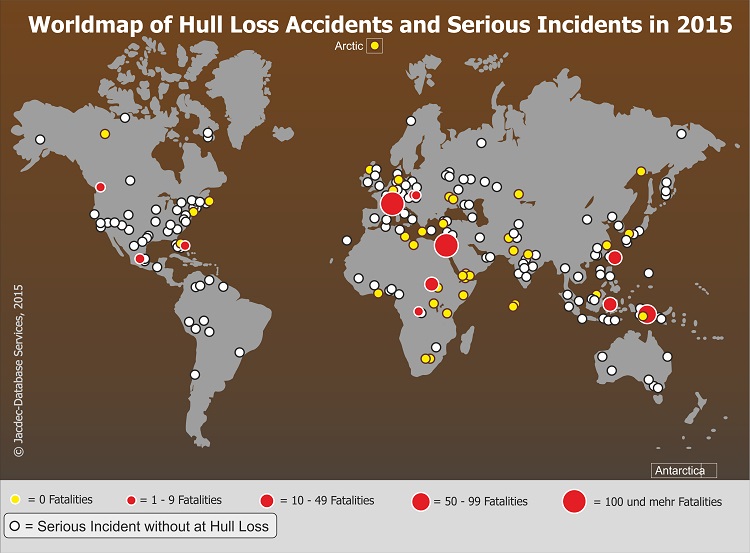
© JACDEC the Flight Safety Bureau